1.0 Basics of Retention analysis
What is Retention Analysis?
User retention is a key metric used across various businesses to measure the ratio of users who come back in specific time interval to use a product or service. For example, if a company like Netflix acquires some X number of subscribers in a month, then it would be valuable insight for the company to measure how many of these subscribers return back or resubscribe to the services every subsequent month
Why do a retention analysis?
Retention analysis helps the business understand user behavior and when this is done across different product segments, it helps to business identify which products have higher stickiness and which does not. It can help to identify the exact point of time when a product might have faced some friction or issue if the retention rate drops off significantly as compared to historical values. Following are some benefits of doing a retention analysis
- Predict future change in returning customers : Retention gives a good overview on how much value a particular cohort of customers will bring to the business over a particular period of time. This, when compared against the customer acquisition cost, can help calculate the Life time value of a customer cohort.
- Identify best performing product or webpage. Companies uses retention analysis to find which part of their product or services is seeing repeat traffic and thus develop strategies to leverage those parts to the fullest.
- Analyze customer churn or drop-offs : The no of customers dropping in each subsequent month/week can help the business identify the churn rates and thus work on the product to improve the churn rates.
NOTE : Churn rate is nothing but [ 1 – retention rate ]
How to calculate retention rate ?
It is simple to visualize as follows. Let us say a streaming service like spotify has a monthly subscription model. Let us say that some X number of customers subscribed in month 0. Out of these X, let us say that only Y re-subscribed in the very next month i.e Month 1. So, we can say that, for month 1 and for those cohorts of customers who signed in month 0, the retention rate is simply (Y / X ) * 100 . So, retention is calculated for a particular cohort of users
Let us visualize it in the following table :
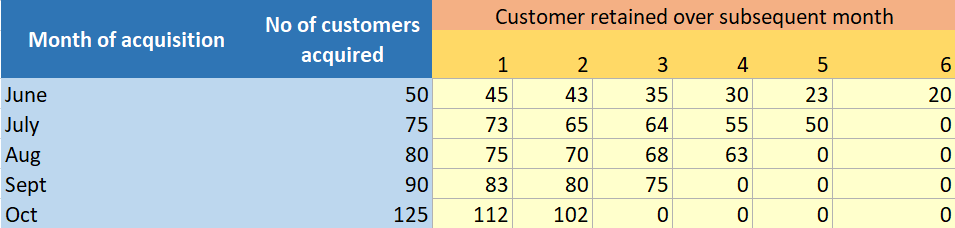
In the above table,
- Month of acquisition: This talks about the particular month in which certain number of customers made the first purchase or signed in for the first time. This is the base cohort on which we will perform the customer retention. Take for example Spotify. So, in the month of June, 50 new subscribers signed up for the service for the first time.
- No of customers acquired: This has been described above as number of customers who first signed up for a service or product. This is our base cohort and this changes every month.
- Customer retained over subsequent month: This simply means, after the month of acquisition, how many customers from that specific cohort, came back in the very next month, then the month after it, and so on. So take for example the Aug cohort. The number 1 ,2,3,4 represents the month Sept, oct, nov and dec respectively after august for which we shall be calculating the repeat customers.
- So, 80 customers were acquired in Aug, out of which,
- 75 returned back in sept, 70 returned back in oct, 68 returned back in nov and 63 returned back in December.
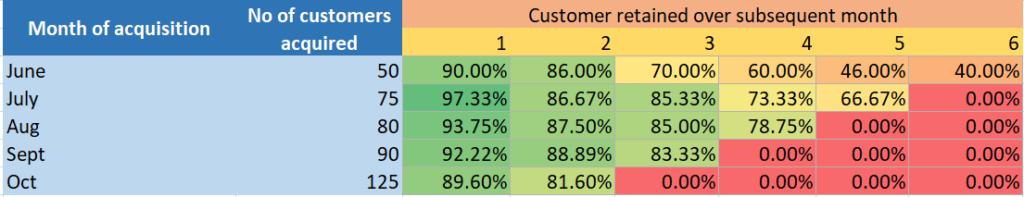
- Now, to convert the above numbers into rates, simply divide the retained customer by the acquired customers. So for August,
- So, customers were acquired in Aug,
- (75/80)*100 = 93.75% customers were retained in the following month.
- Hence the retention rates for all the cohorts is shown in the following table.